pixelPlot02
Launch Java Applet: pixelPlot02
Zipped executables you can download and try:
I wanted to express the color space of an image in 3D. Thinking about it, I figured I could map the ‘hue \ saturation \ value(brightness)’ of an image into XYZ point values. I tried this with RGB values instead of HSV, but I didn’t like the visual “clumping”. That’s wha this sketch does, for a given image: As it runs, it samples a pixels color value, turns it into a XYZ point in space, colors it the color of the pixel, and then plots it. For a given 3d point, if it is plotted multiple times, it will start to grow.
The below image showcases this, but you really need to see it in action. I also have some video’s of it on Flickr here, here, and here.
The pixels being plotted in 3D
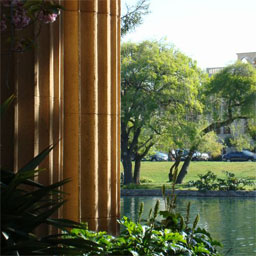
The source image being sampled
No comments yet.